Writing · fleet-risk-lakehouse
Same Query. Same Table. Two Different Answers.
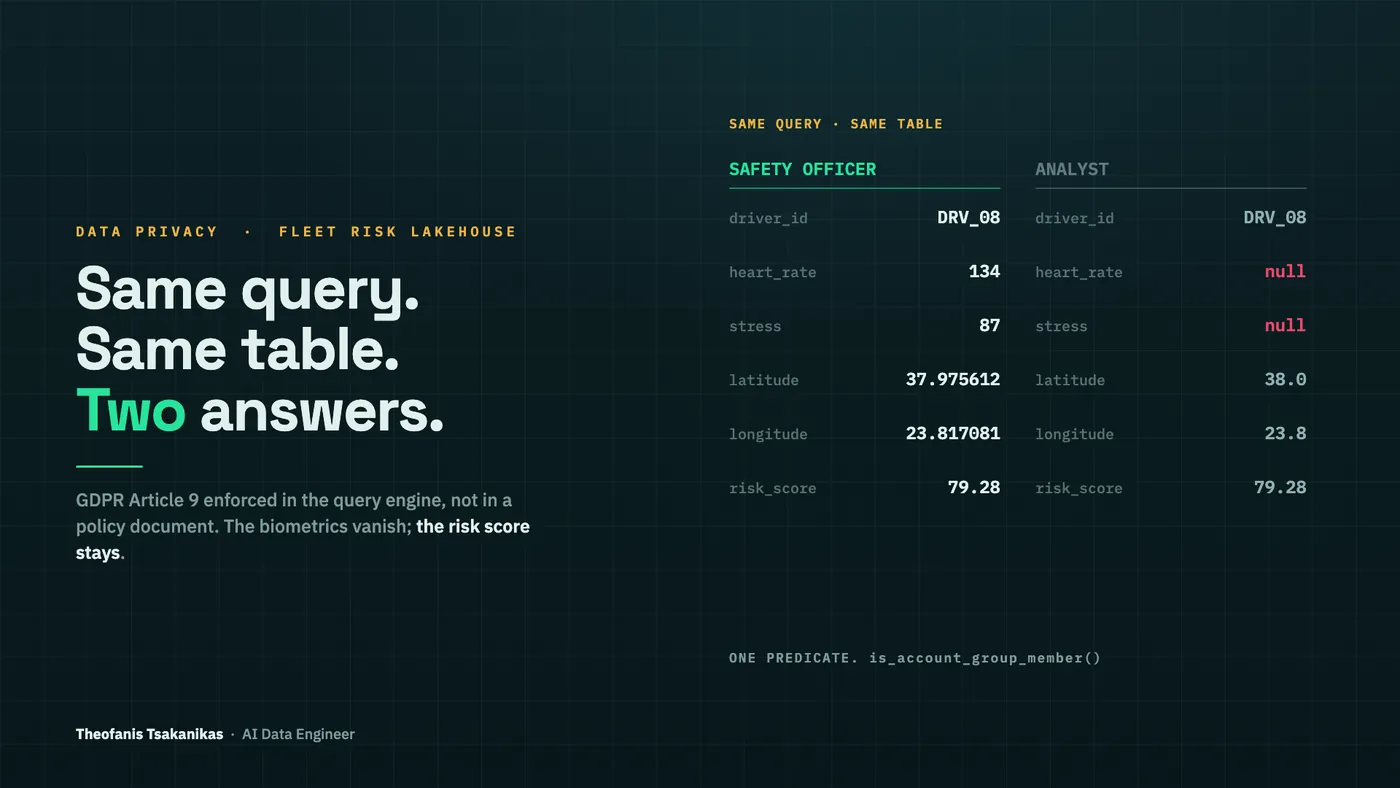
A safety officer runs a query against the driver table and sees a heart rate of 134 bpm and a GPS position to six decimal places.
An analyst runs the identical query, against the identical table, and gets NULL for the heart rate and a location rounded to about 11 kilometres.
Nothing in the data changed. Nothing in the query changed. The only thing that changed was who was asking — and that is the whole point. Most GDPR compliance is a document describing what people should do with sensitive data. This is a platform that makes the wrong thing impossible.
Two signals that mean nothing apart
The system correlates vehicle telemetry (GPS, speed, fuel) with driver biometrics (heart rate, stress) to score fleet-safety risk in near real time.
The premise is specific: a driver can pass every individual check — legal speed, "normal" heart rate — and still be one moment from an incident. Speed alone doesn't tell you. Biometrics alone don't either. Together they do.
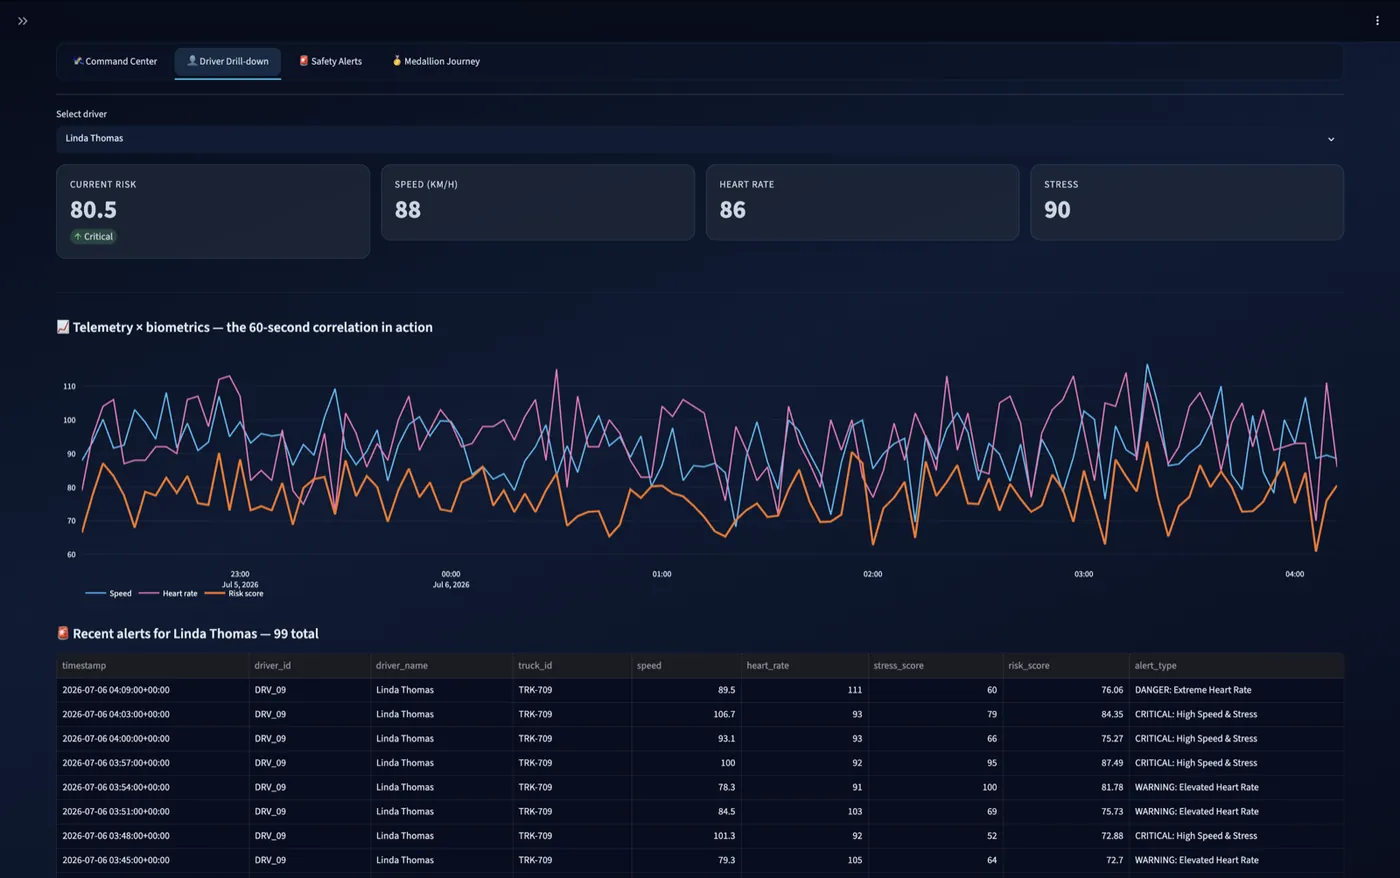
That join window is not arbitrary, and it isn't buried in a comment. It's ADR-002, one of ten Architecture Decision Records in the repo. Choosing 60 seconds has a real consequence: a driver with two GPS events inside the window produces two joined rows. The live-status table resolves it with a ROW_NUMBER() window keeping the most recent match; the alerts table deliberately keeps all of them. Different tables, different correctness requirement, documented either way.
A score that shows its work
The risk score is a transparent linear index, not a learned model. For a score that escalates to a human being — a fleet manager phoning a driver mid-shift — that is a deliberate and defensible choice. Every point traces to a factor and a weight, and the whole model fits on one page:
# RiskFactor(name, source_column, weight, denominator)
factors: tuple[RiskFactor, ...] = (
    RiskFactor("speed", "speed", 40.0, 120.0),
    RiskFactor("stress", "stress_score", 35.0, 100.0),
    RiskFactor("heart_rate", "heart_rate", 25.0, 110.0),
)
Crucially, the Gold layer doesn't just emit the number. It emits each factor's point contribution (risk_speed_pts, risk_stress_pts, risk_heart_rate_pts) and a risk_primary_factor column. So the top driver in the screenshot below isn't just "risk 79.28" — it's "31.33 of those 79.28 points came from speed," and the risk_primary_factor column says so outright.
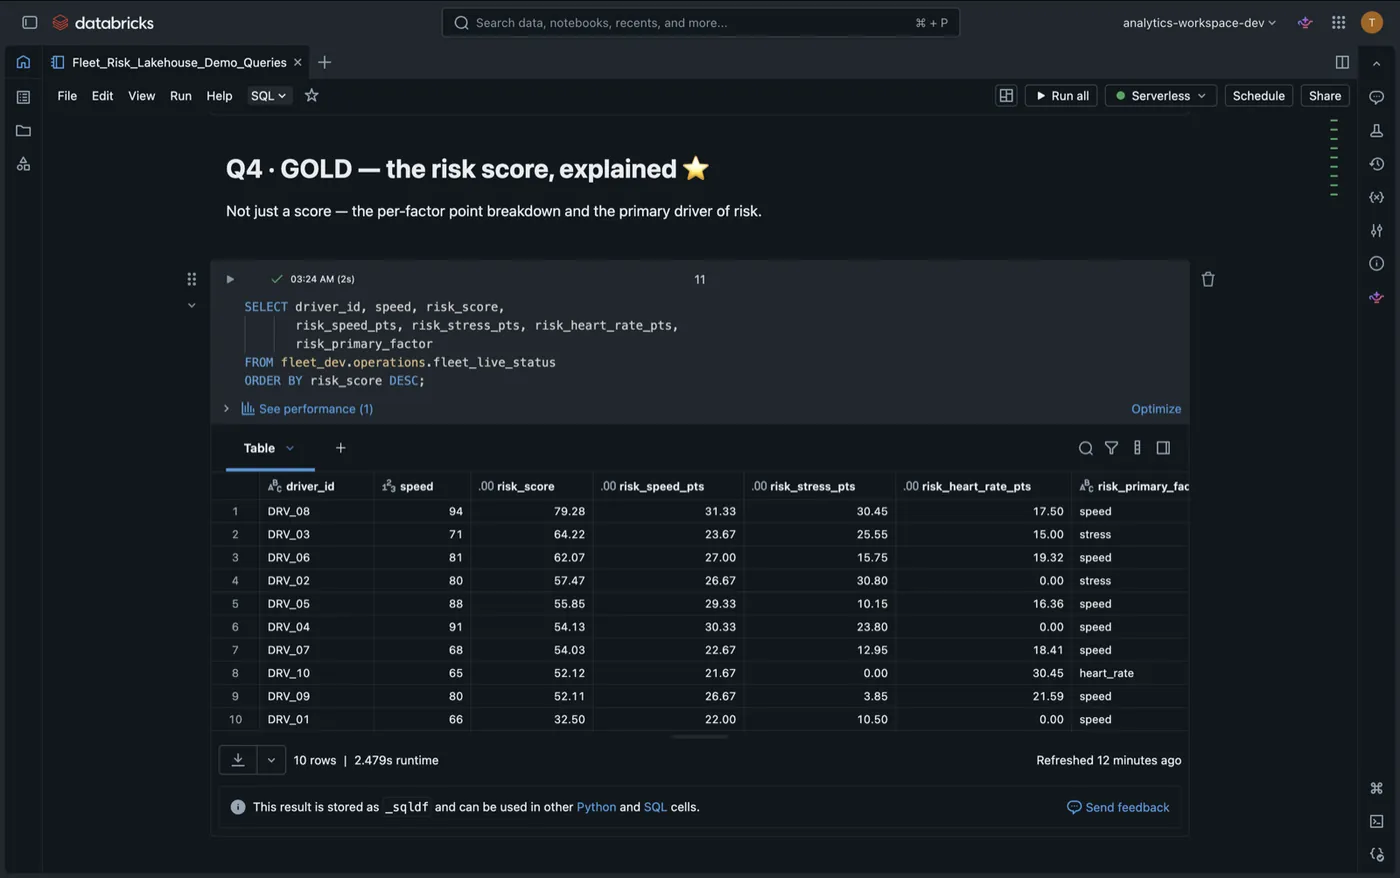
The model object is the single source of truth. gold.py builds the SQL from it, and the generated risk model card reads from the same object. Change a weight and the documentation changes with it, or CI's --check fails the build. The formula cannot drift from the document that describes it, because there is only one of them.
Same query, two answers
Heart rate and stress are classified in code as special-category data under GDPR Article 9 — the tier that covers health data, where the legal default is prohibited unless a specific exemption applies.
Classifying it documents the obligation. It does not enforce it. The enforcement is a Unity Catalog column mask: a SQL function bound to a column that the engine applies on every single read.
CREATE OR REPLACE FUNCTION mask_biometric(val INT)
RETURN CASE WHEN is_account_group_member('fleet_safety_officers')
            THEN val ELSE NULL END
That is the entire privacy boundary. One predicate.
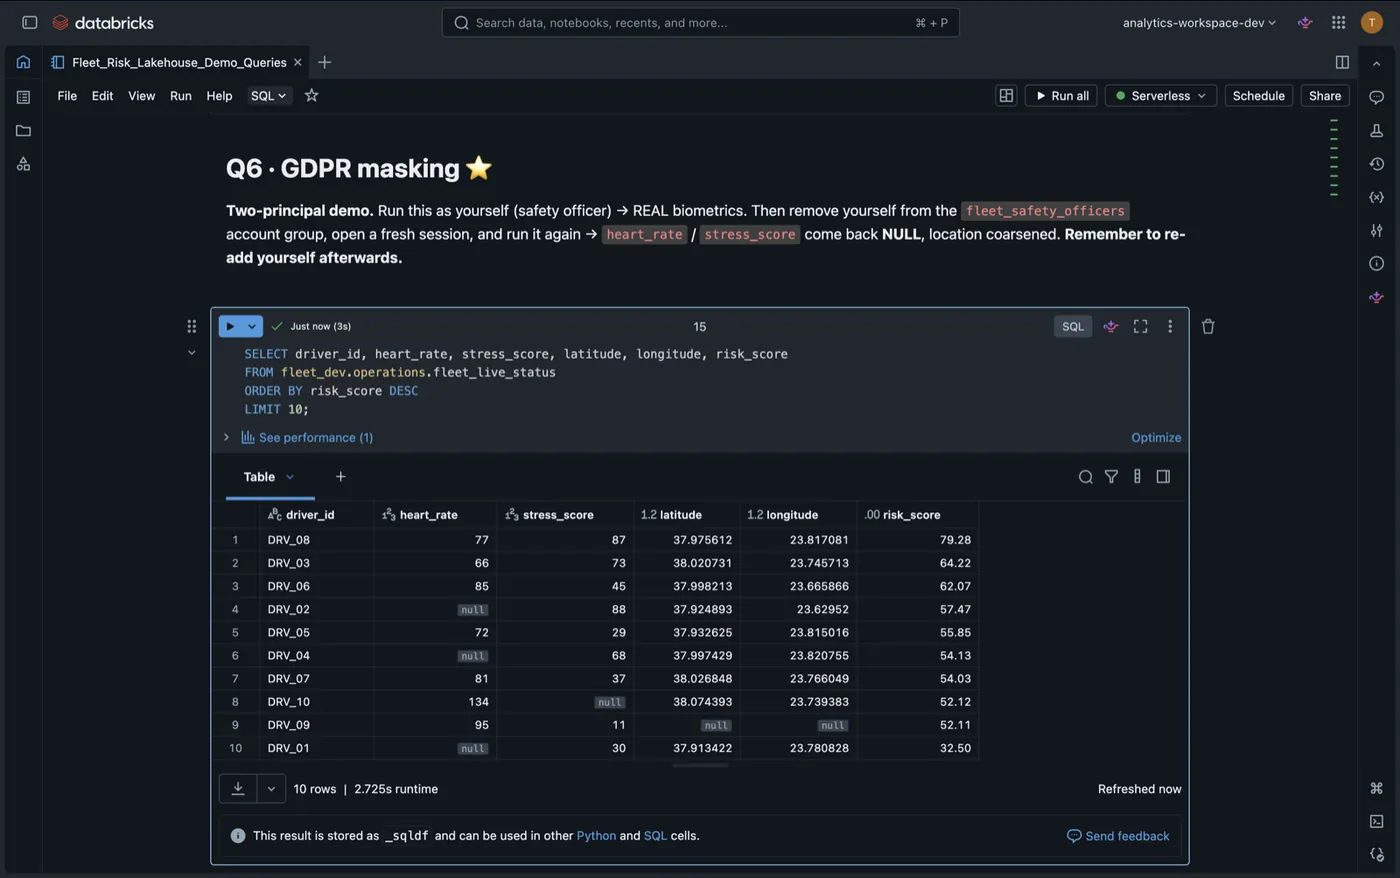
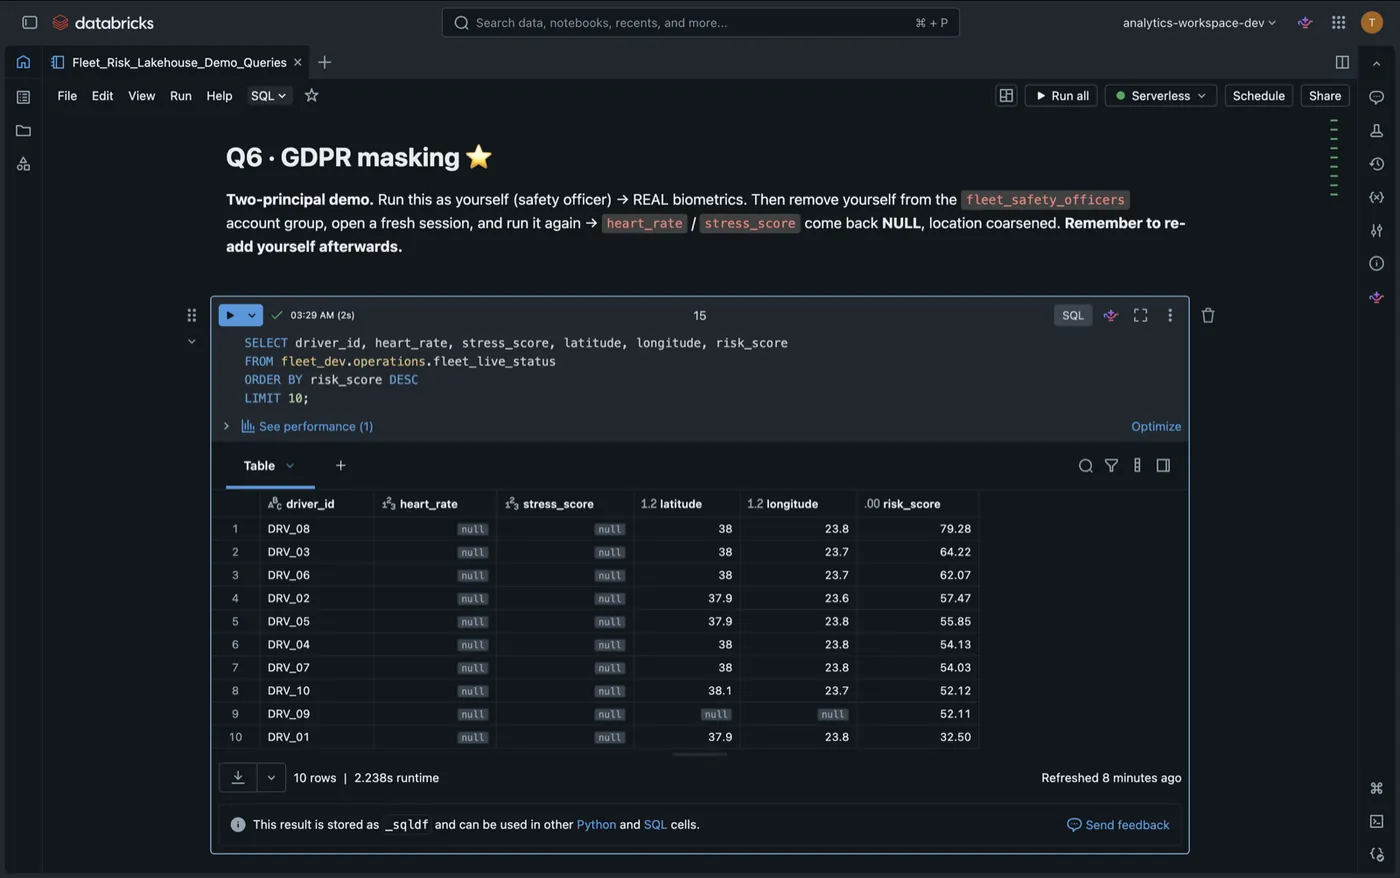
null; location rounds to one decimal (~11 km). No application code is involved.Look closely at the second screenshot: risk_score is still there. That is the design in one detail. The raw physiological signal is masked; the derived operational decision is not. An analyst can build fleet-wide risk trends, rank drivers, and investigate patterns — without ever seeing a heartbeat. Location is coarsened rather than nulled for the same reason: route analytics keep working at 11 km resolution, and a driver's precise whereabouts stop being visible.
The mask is derived, never hand-kept
The masks are generated from the column classification, not from a list someone maintains:
def masked_columns() -> tuple[str, ...]:
    """All columns that get a mask, from the classification (enriched + aggregates).

    Special-category and location columns, plus the aggregates that inherit those
    categories (avg_heart_rate / avg_stress) — never a hand-kept list.
    """
    return tuple(col for col, c in _maskable_index().items() if c.category in _MASKS)
A CI test fails if any Gold column is left unclassified. So a new column cannot quietly join the platform without someone deciding what it is. That's the difference between a control and a convention: a convention is followed until the day someone is in a hurry.
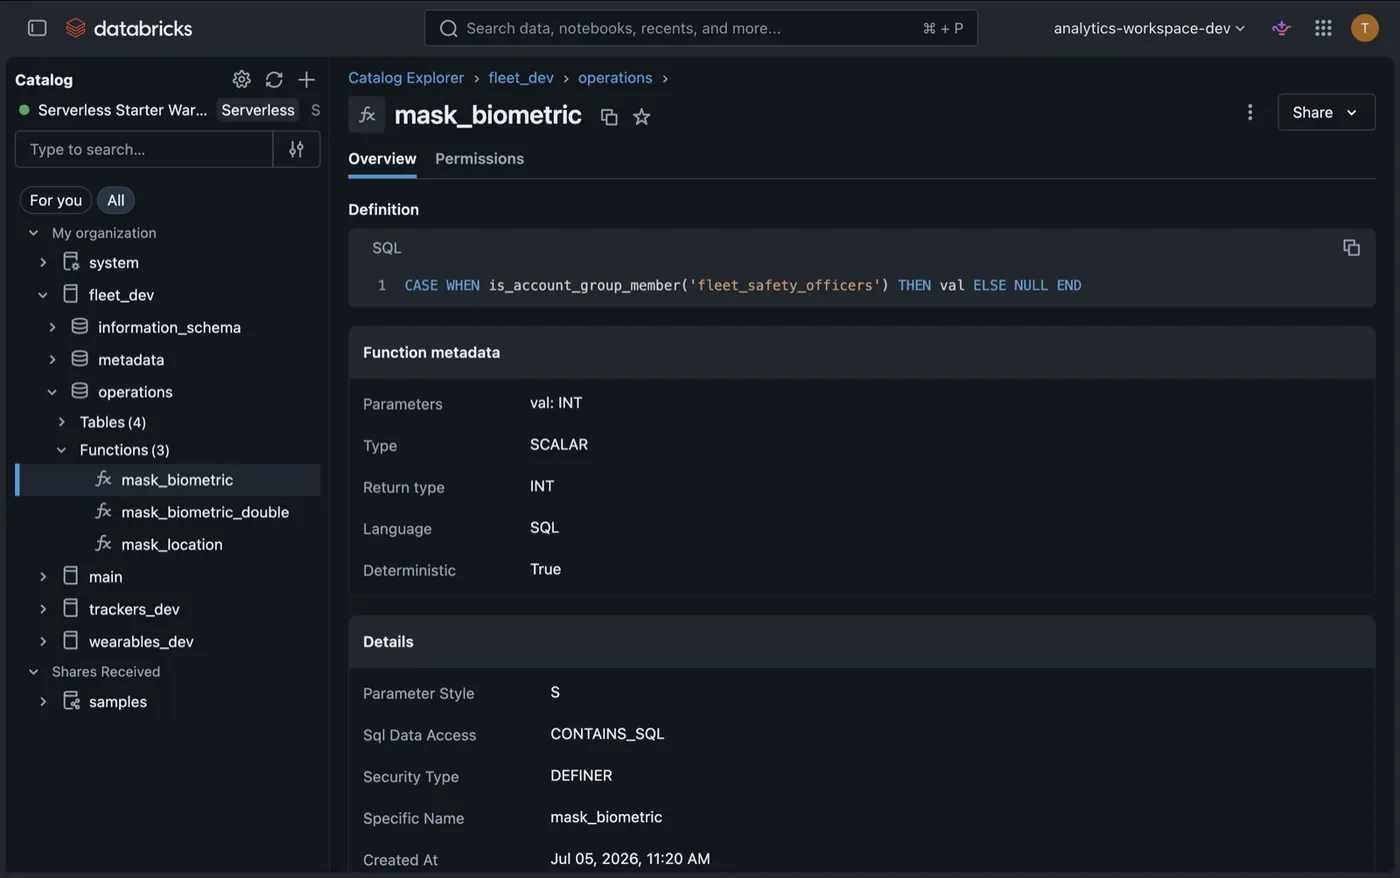
CASE WHEN. And val: INT explains the sibling mask_biometric_double: a mask's parameter type must match the column exactly.Coverage is the part that's easy to get wrong. The masks apply to all four Gold surfaces — live status, safety alerts, the aggregate metrics table, and the data-quality quarantine table. That last one matters: rows that failed a quality check are still raw Article 9 biometrics, and a quarantine table is exactly the kind of side output that gets forgotten. And aggregates get masked too, because per-driver averaging does not de-identify anything.
The alert that must not carry what it knows
When risk turns critical, the pipeline pushes to Slack and PagerDuty — event-driven from the Gold run itself, not by a dashboard polling on a timer.
This is where masking alone would fail. Column masks protect reads from the table. A notification built inside the pipeline, running as a privileged principal, sees unmasked values and would happily post a driver's heart rate into a Slack channel — outside the platform, outside Unity Catalog, outside every control.
So the payload is built from an allowlist, not by removing fields:
# The ONLY fields allowed into an external notification: operational + derived + identifiers.
# Deliberately excludes special-category biometrics (heart_rate / stress_score) — enforced by
# test_notify_fields_exclude_special_category against the governance classification.
NOTIFY_FIELDS: tuple[str, ...] = (
    "timestamp", "driver_id", "truck_id", "speed",
    "risk_score", "risk_primary_factor", "alert_type",
)

def safe_view(row):
    """Project row onto NOTIFY_FIELDS (drops biometrics and anything unlisted)."""
    return {k: row.get(k) for k in NOTIFY_FIELDS}
A test asserts that this allowlist shares no column with classification.special_category_columns(). A denylist would need updating every time a column is added. An allowlist fails closed by default: a new field simply isn't sent until someone consciously adds it.
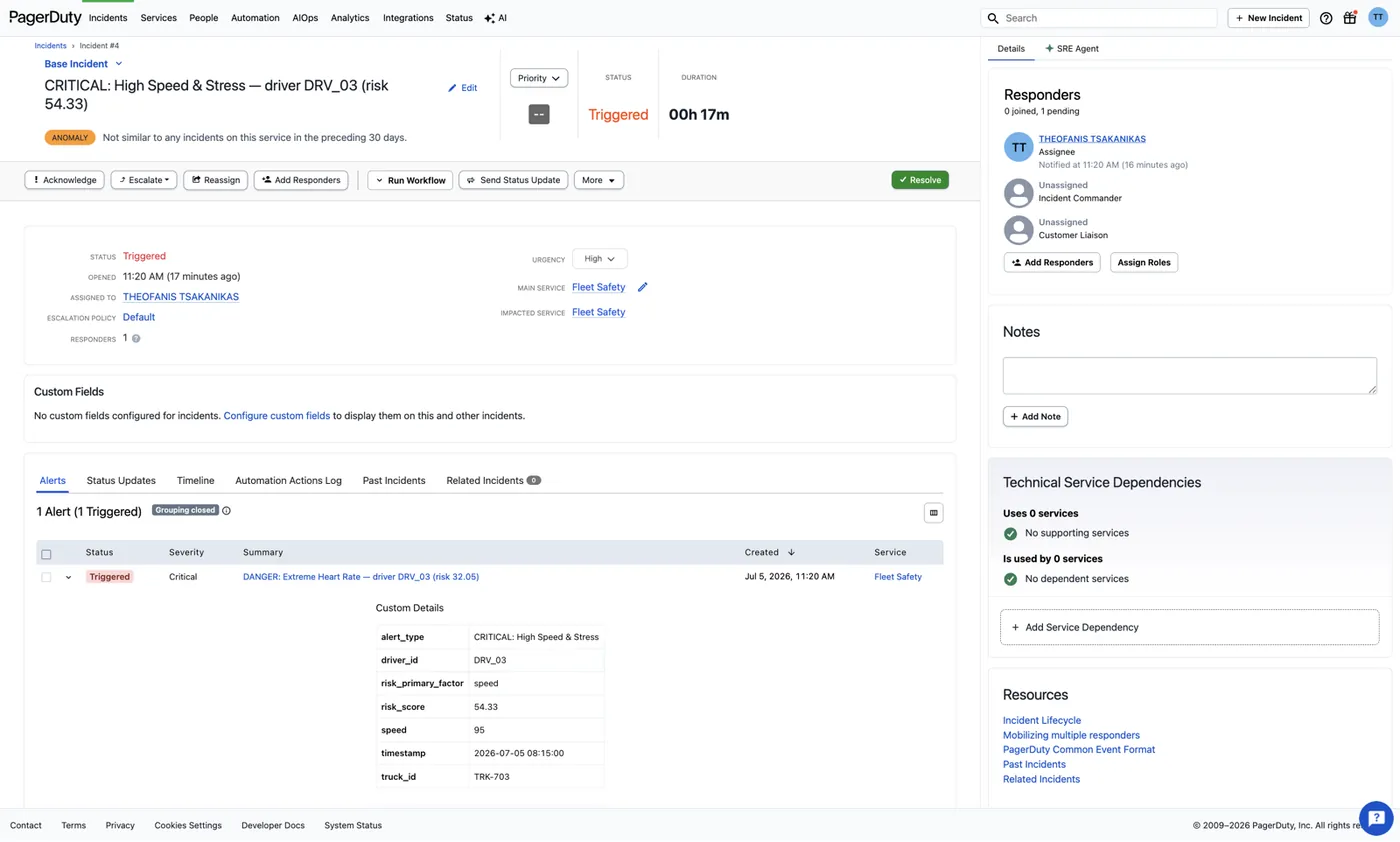
What this is worth outside the engineering team
A privacy control that lives in the query engine cannot be forgotten. Every application, every dashboard, every ad-hoc notebook, every future tool nobody has built yet inherits it automatically. The alternative — each consumer implementing its own redaction — means the protection is only as strong as the least careful integration, and you find out which one that was during a breach.
"We document that analysts shouldn't look" is not a control. It's an expectation, and expectations don't produce evidence. When a regulator asks how special-category data is protected, "here is the function, here is the group membership check, here is the same query returning different results" is an answer. A policy PDF is not.
Aggregation is not anonymisation, and that assumption is expensive. The average heart rate of one named driver is that driver's health data. The system masks aggregates for exactly this reason, and it's one of the most common places privacy programmes leak.
The quarantine table is the one nobody thinks of. Data that failed validation is still personal data. If your quality process routes bad rows somewhere for inspection, that destination needs the same protection as the table it was rejected from.
The pipeline keeps a score on itself
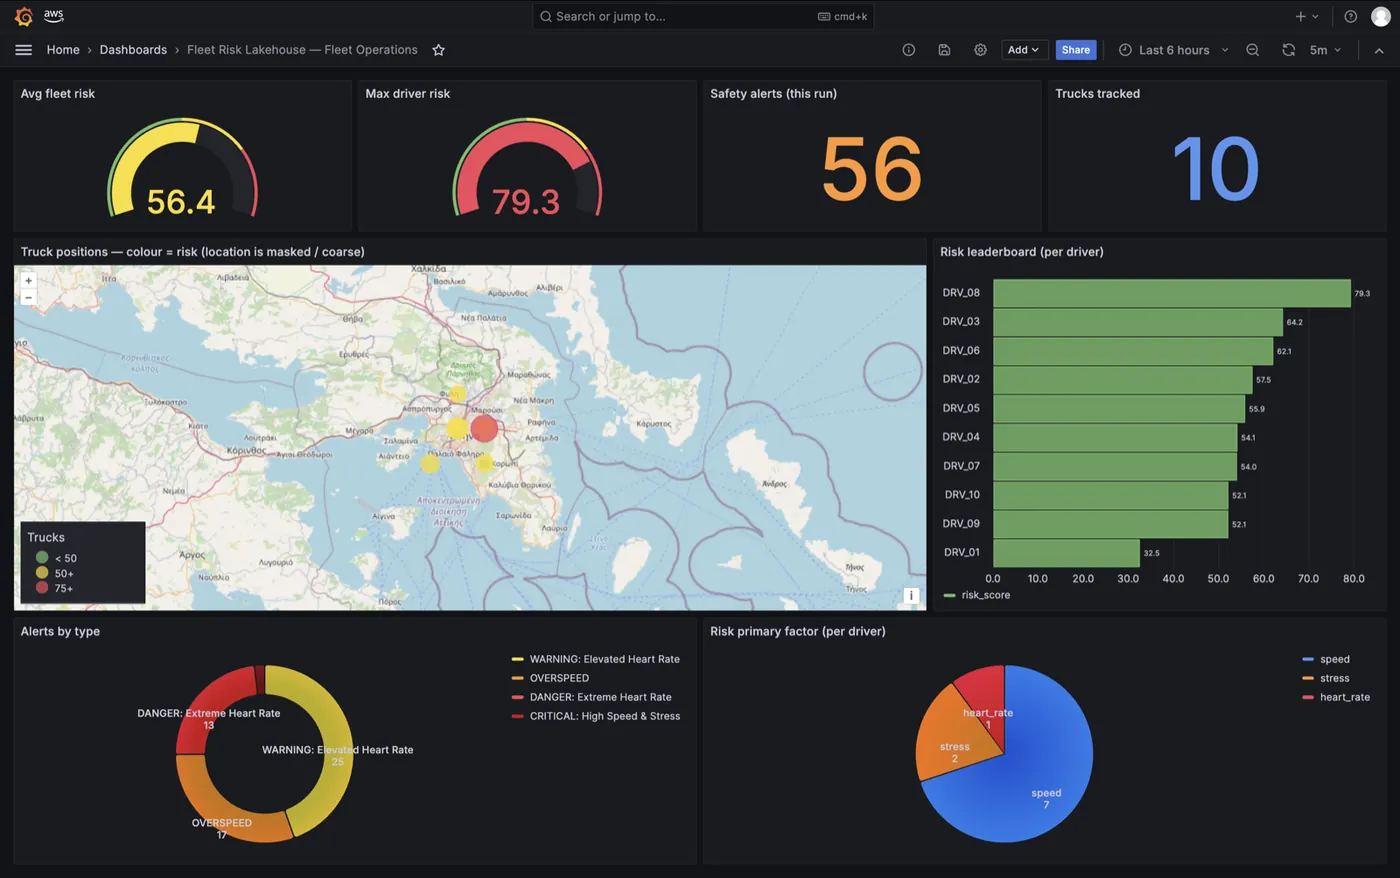
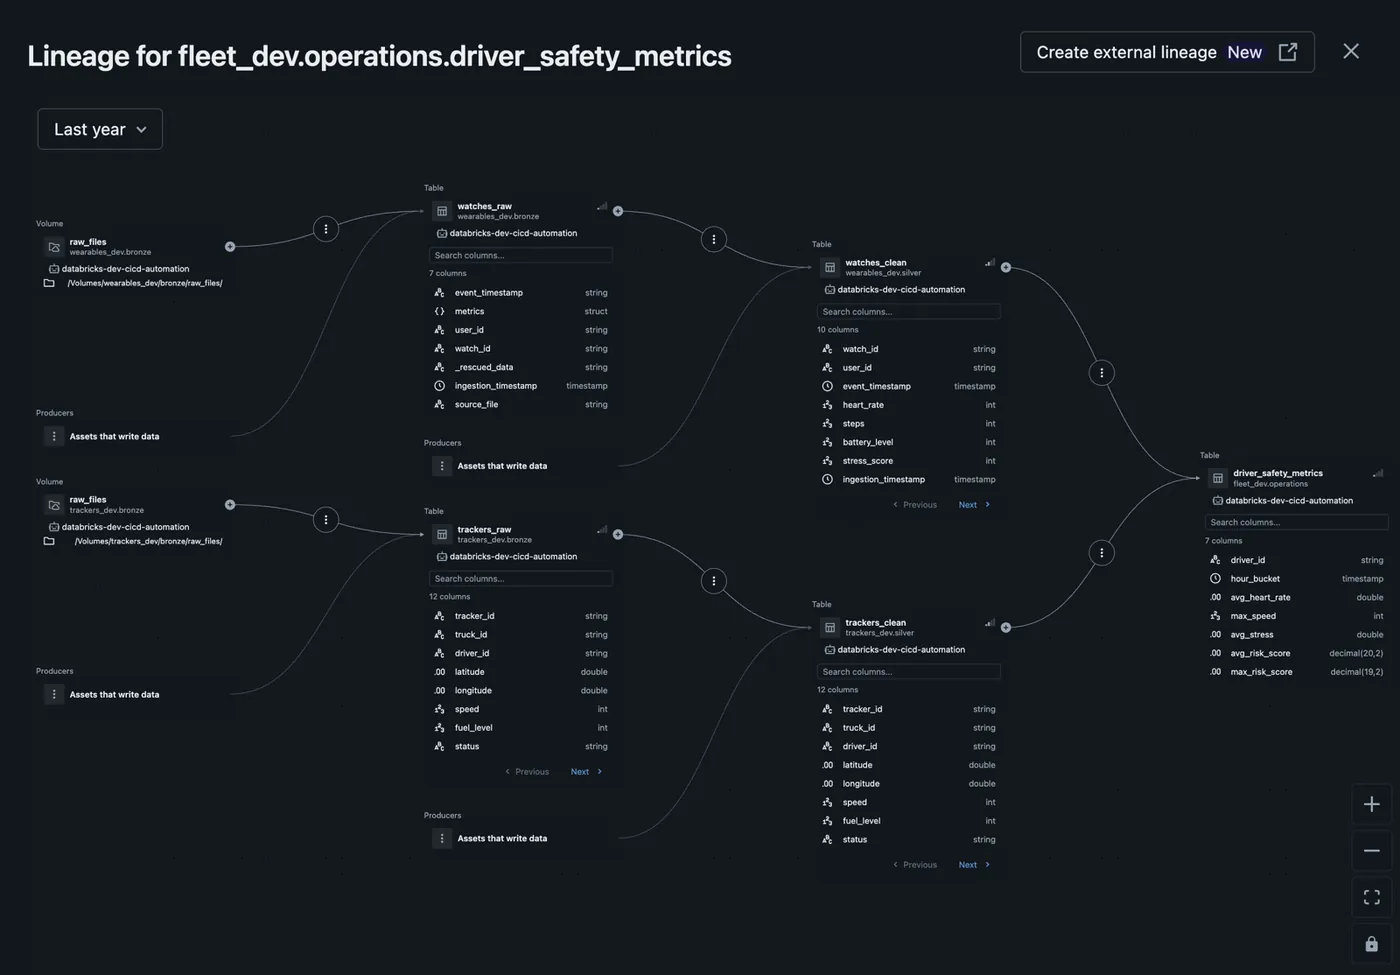
pipeline_metrics. And the geomap's own title says it: coarse location, because Grafana's principal sits outside fleet_safety_officers.Every run appends to a pipeline_metrics fact: row counts per layer, the join match rate, how many rows were quarantined, the risk-score PSI against a baseline, and the risk-band distribution.
Drift is deliberately a WARN, not a failure. A significant PSI usually means a sensor cohort was recalibrated or a config changed upstream — not that the fleet suddenly got more dangerous. Failing the pipeline on that would train everyone to ignore it.
And a detail that says a lot: the Grafana service principal is a read-only BI identity that is deliberately not in fleet_safety_officers. So the dashboards respect the column masks by construction. The privacy boundary wasn't bolted onto the BI layer; the BI layer was simply given an identity that sits on the correct side of it.
Quality that quarantines instead of deleting
Gold tables are guarded by named SQL expectations with ERROR / WARN severities. Rows that violate an ERROR expectation are quarantined to a side table, annotated with a _dq_failures column explaining which expectation they broke — not silently dropped.
The Silver layer follows the same philosophy: it drops rows that are unrecoverable (a ghost driver id, a malformed device id) but nulls individual bad sensor readings while keeping the row — GPS at exactly (0,0), speed of -1 or 999, heart rate of -999, 0 or above 220. It never fabricates a replacement value.
That distinction — clean, don't destroy; and never invent — is what keeps a data-quality layer honest. Imputing a plausible heart rate would make the dashboards prettier and the risk scores fiction.
A row that gets overwritten cannot testify
One more piece of modelling rigour, and it exists for a specific reason.
Drivers change trucks. If the driver → truck mapping is a single mutable row, then the moment an assignment changes you have quietly destroyed the ability to answer which truck was this driver in when the incident happened.
So dim_driver is a slowly-changing dimension, Type 2, maintained with a Delta MERGE:
DIM_COLUMNS: tuple[str, ...] = ("driver_id", "truck_id", "valid_from", "valid_to", "is_current")A new truck closes the open version — sets its valid_to and flips is_current to false — and opens a fresh one. Nothing is overwritten, so every past assignment is still queryable at the time it was true.
The transition logic lives in a pure, deterministic Python function whose semantics the SQL MERGE mirrors, so the rule can be unit-tested without a warehouse. The SCD2 task runs in parallel with Gold enrichment, depending only on the trackers stream.
Five Terraform layers, two jobs, one command
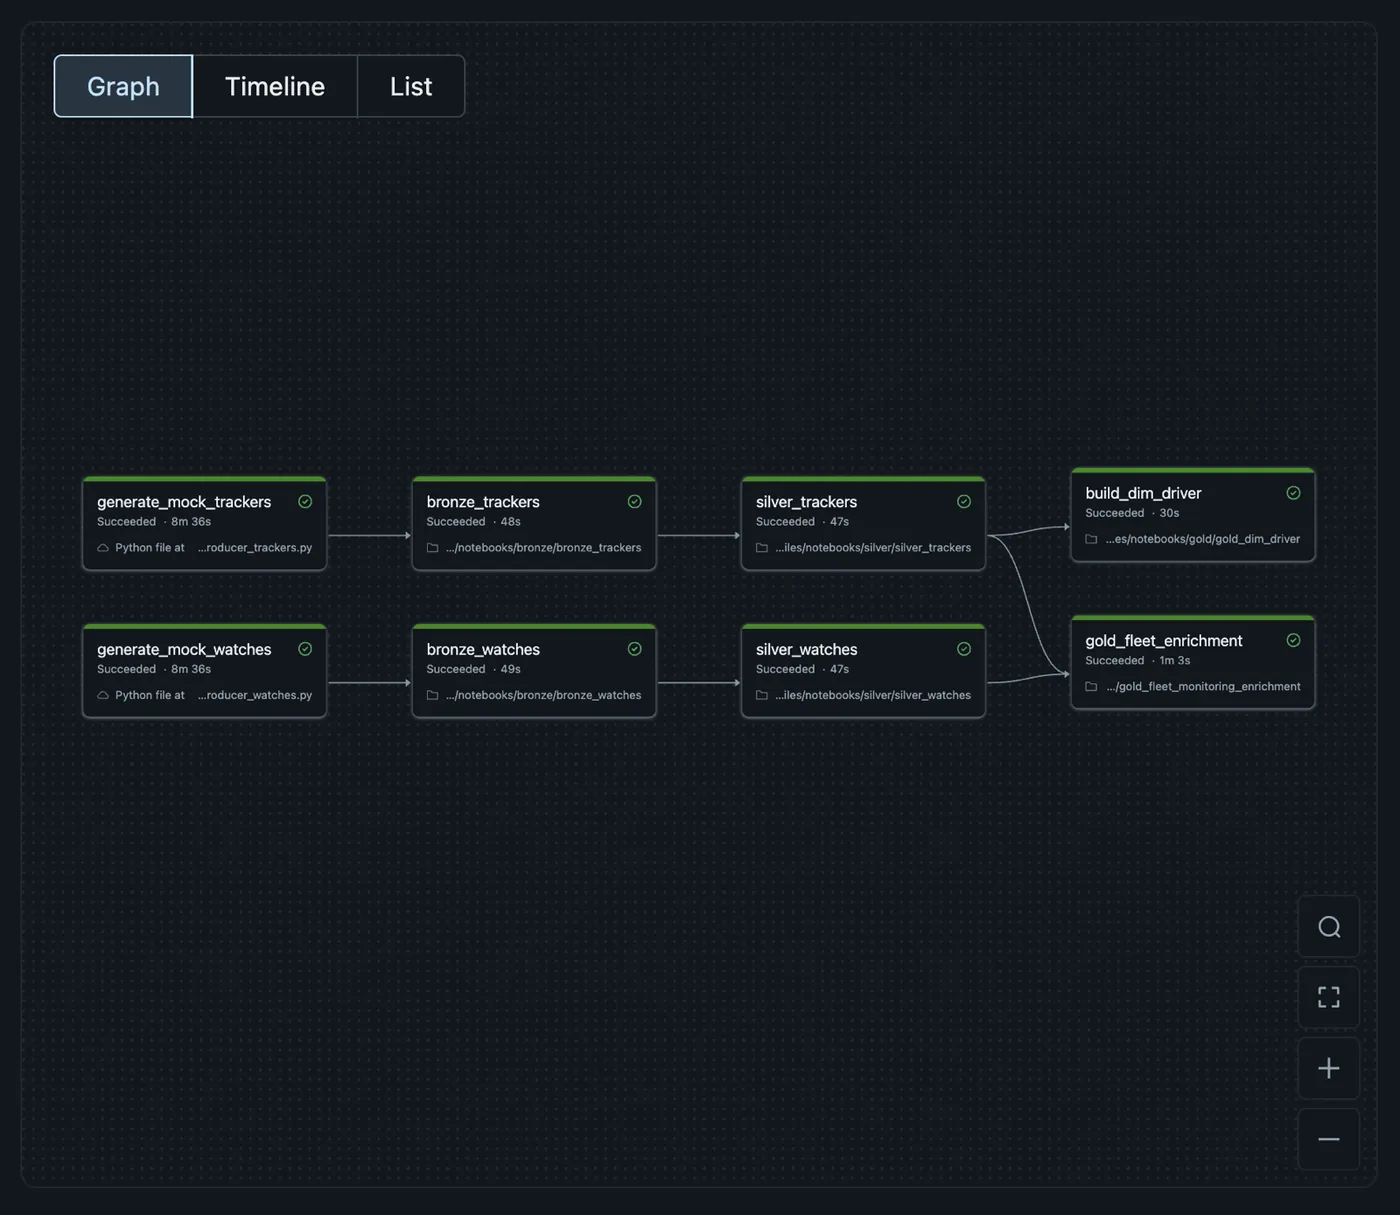
build_dim_driver branches off silver_trackers and runs beside Gold enrichment; the VED-replay job runs the same six downstream tasks by YAML alias.Everything is Infrastructure as Code across five isolated Terraform layers with per-layer remote state, so a failed apply on the Unity Catalog layer cannot corrupt the foundation layer's state. AWS auth in CI is keyless via GitHub OIDC. The deploy workflow is manual-only, so merging to main cannot deploy infrastructure. Grafana's datasource and dashboards are provisioned entirely in Terraform — over the free OSS Infinity datasource against the Databricks SQL Statement Execution API, because the official Databricks Grafana plugin is Enterprise-only at +$45 per active user per month.
173 tests gate every push, all of them infrastructure-free: pure Python and local PySpark, no cloud calls.
The pipeline runs two jobs with the identical 8-task DAG. One uses mock generators with deliberate error injection. The other replays real vehicle telemetry — genuine GPS traces, speeds and hard-braking events from the Vehicle Energy Dataset — through the exact same contract, with biometrics simulated conditioned on those real driving events. The downstream tasks are YAML aliases of the same definitions, so the two paths cannot drift apart.
What I'd tell you before you looked
The Gold layer is a micro-batch recompute, not continuous streaming (ADR-004). The stateless SQL builders port directly to a stateful stream-stream join with watermarks if the freshness requirement ever tightens below the run interval, but today it is a batch job on a trigger and calling it "real-time streaming" would be a stretch.
Teardown of the Databricks metastore is a documented two-pass operation, because the API refuses to delete it from CI even with force_destroy. That's in the runbook rather than discovered at 2am.
And the biometrics in the replay job are simulated. The vehicle telemetry is real; the heart rates conditioned on it are not, because there is no public dataset that pairs the two. Saying so is cheaper than being asked.
The takeaway
Privacy engineering fails when it lives in a layer that people can route around. A redaction in the dashboard is bypassed by a notebook. A redaction in the notebook is bypassed by an export. A policy in a PDF is bypassed by a deadline.
Push it down to the engine, derive it from a classification that CI enforces, and the question stops being "did everyone remember?" It becomes "which group are you in?" — which is a question with an answer.
Full repo, with the ten ADRs, the Terraform layers and the governance docs generated from the code: https://github.com/theofanis-tsakanikas/fleet-risk-lakehouse
If you handle special-category data: is your redaction in the query engine, or in each application that reads it? I'd like to hear which way teams have gone, and what it cost them.
One of a series of write-ups on the projects in my portfolio — each one a reference implementation of the trust layer that makes data and AI safe to ship.
The code, the CI and every test behind this article are public.